Stocks, explained · October 17, 2026

Today, in brief.

The news. The catch. The business impact.
More context, one tap away.

Brief first

The quick catch-up.

Six briefs to start. Tap for the catch, the context and the next checkpoint.

ASML

ASML sees more demand than planned capacity. Expansion is the next test.

ASML says planned supply would fall short of customers’ expected demand in 2027 and 2028.[A1]

The catch + why you care

Additional 2028 capacity is under investigation; interest in later orders is not booked revenue.[A1]

Can demand become delivered machines without weakening the economics?

Our view: track what can be built and delivered, alongside what customers say they want.

Full analysis, next checkpoint & sources ↗
LUV

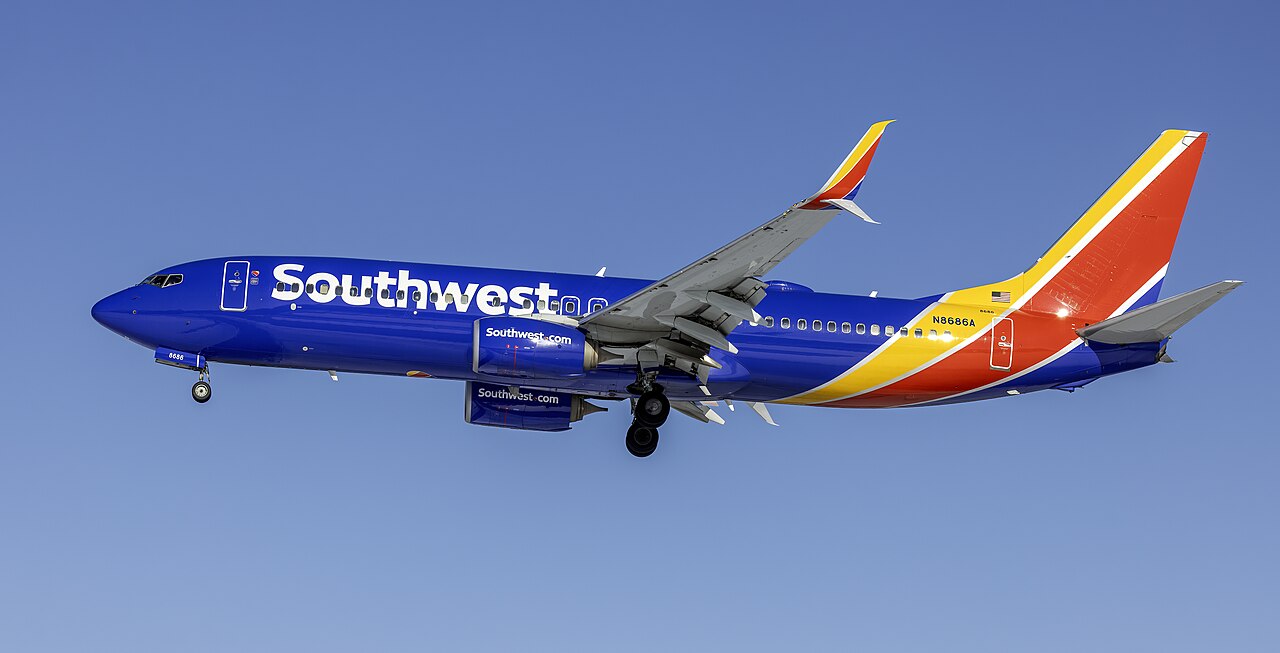
Southwest has Starlink on 47 planes. The next rollout update matters.

47 equipped aircraft is a reported snapshot; more than 300 by year-end was Southwest’s February target.[S1] [S2]

The catch + why you care

Southwest’s help page points to full-fleet coverage in fall 2027, an expectation rather than a completed rollout.[S3]

Can a better inflight experience produce a better airline business?

Our view: installation progress can be measured before the loyalty or earnings benefit can.

Full analysis, next checkpoint & sources ↗
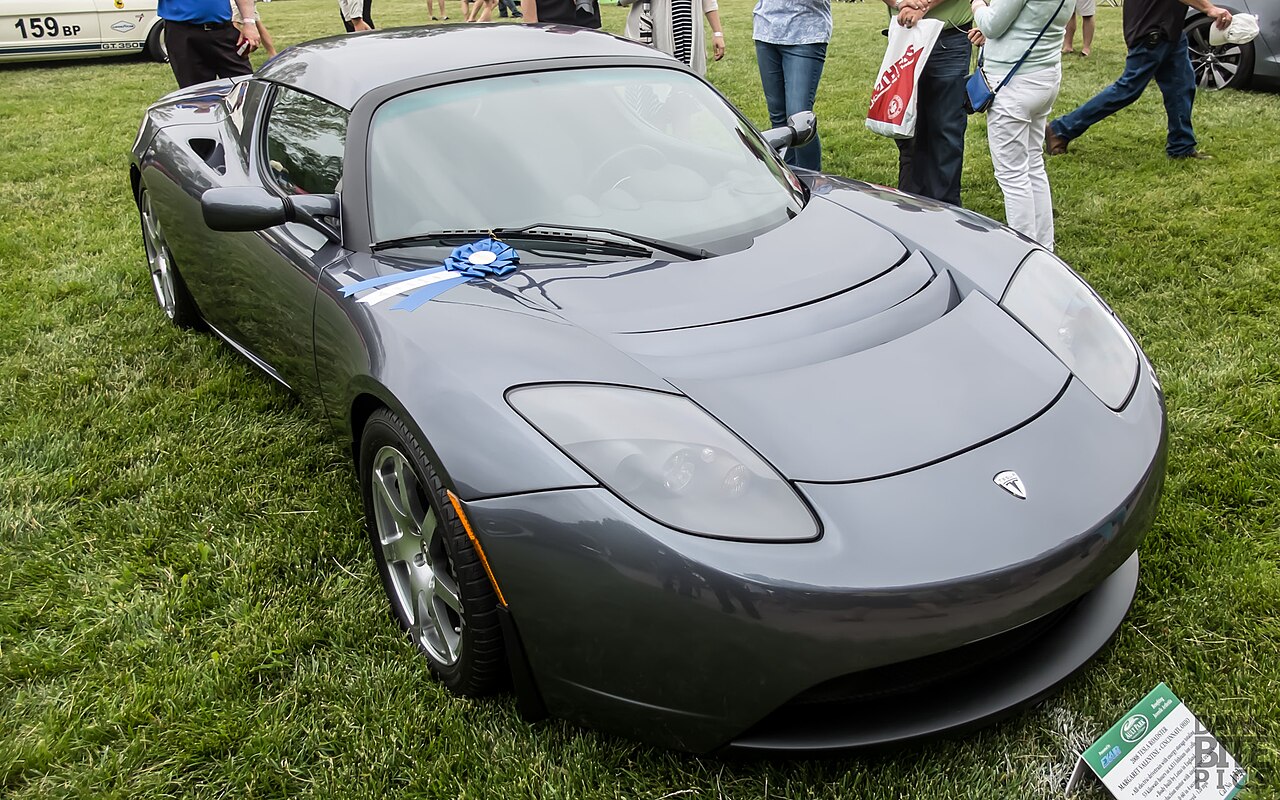
TSLA

Tesla’s Roadster can grab attention. Earnings need a different kind of lift.

AP corroborates the demonstration; production in 2028 is an attributed management ambition.[R1] [R4]

The catch + why you care

Tesla has scheduled Q3 financial results for October 21, after market close.[R2]

What would turn a product spectacle into a financial contribution?

Our view: the Roadster’s potential brand value and its future earnings contribution need separate evidence.

Full analysis, next checkpoint & sources ↗

Reporting checked October 17, 2026. These briefs are dated analysis, not a rolling news feed.

Go a little deeper

Your reading room.

9 stories. Clear takeaways. Checkable sources.

9 articles
Market context

See the market around the story.

A Nasdaq-100 heatmap, plus 50 technology and tech-related names to explore.

Open TradingView ↗

Price meets expectations.

Five widely followed stocks. What the market paid, and what analysts expect.

Check a current quote

Dated snapshot: regular-session close October 16, 2026, 4 p.m. EDT. USD per share. Checked October 17. These figures do not update automatically.

NVDA

Nvidia

Last close
$214.13
Average 1-year target
$328.72
Implied price change
+53.5%
Range, source & valuation

Analyst targets range from $180.00 to $515.00. 62 analysts in the source’s S&P Global poll. Source’s forecast update date: .

Below the average target; fair value undetermined. This compares a recorded close with analyst forecasts. It does not establish intrinsic value or predict a return. The lowest target is -15.9% from that close.

Our calculation: (average target ÷ last close − 1) × 100. Excludes dividends, fees and taxes. A 1-year target is a future price estimate, not a present fair-value estimate.

Source: Stock Analysis / S&P Global forecast data for NVDA

META

Meta Platforms

Last close
$709.33
Average 1-year target
$814.51
Implied price change
+14.8%
Range, source & valuation

Analyst targets range from $580.00 to $1,050.00. 63 analysts in the source’s S&P Global poll. Source’s forecast update date: .

Below the average target; fair value undetermined. This compares a recorded close with analyst forecasts. It does not establish intrinsic value or predict a return. The lowest target is -18.2% from that close.

Our calculation: (average target ÷ last close − 1) × 100. Excludes dividends, fees and taxes. A 1-year target is a future price estimate, not a present fair-value estimate.

Source: Stock Analysis / S&P Global forecast data for META

AMZN

Amazon

Last close
$250.00
Average 1-year target
$331.46
Implied price change
+32.6%
Range, source & valuation

Analyst targets range from $230.00 to $405.00. 60 analysts in the source’s S&P Global poll. Source’s forecast update date: .

Below the average target; fair value undetermined. This compares a recorded close with analyst forecasts. It does not establish intrinsic value or predict a return. The lowest target is -8.0% from that close.

Our calculation: (average target ÷ last close − 1) × 100. Excludes dividends, fees and taxes. A 1-year target is a future price estimate, not a present fair-value estimate.

Source: Stock Analysis / S&P Global forecast data for AMZN

GOOGL

Alphabet Class A

Last close
$340.59
Average 1-year target
$430.51
Implied price change
+26.4%
Range, source & valuation

Analyst targets range from $340.00 to $515.00. 62 analysts in the source’s S&P Global poll. Source’s forecast update date: .

Below the average target; fair value undetermined. This compares a recorded close with analyst forecasts. It does not establish intrinsic value or predict a return. The lowest target is -0.2% from that close.

Our calculation: (average target ÷ last close − 1) × 100. Excludes dividends, fees and taxes. A 1-year target is a future price estimate, not a present fair-value estimate.

Source: Stock Analysis / S&P Global forecast data for GOOGL

MSFT

Microsoft

Last close
$529.05
Average 1-year target
$599.24
Implied price change
+13.3%
Range, source & valuation

Analyst targets range from $440.00 to $870.00. 56 analysts in the source’s S&P Global poll. Source’s forecast update date: .

Below the average target; fair value undetermined. This compares a recorded close with analyst forecasts. It does not establish intrinsic value or predict a return. The lowest target is -16.8% from that close.

Our calculation: (average target ÷ last close − 1) × 100. Excludes dividends, fees and taxes. A 1-year target is a future price estimate, not a present fair-value estimate.

Source: Stock Analysis / S&P Global forecast data for MSFT
So, is a stock fairly valued?

A price target alone cannot answer that. A present-value estimate needs explicit assumptions about future cash flows, growth, risk and share count. We have not built or verified a company-specific valuation model for these stocks, so we do not label them undervalued or overvalued. Use the target range to understand disagreement, then read the business evidence before deciding.

Check the current quote.

Select any of our 50 stocks, then load its TradingView quote. Data may be delayed; check the provider’s timestamp and session. This quote does not change the dated target comparison above.

Loads an external widget. Privacy details

No quote widget loaded.

Open selected stock on TradingView

Nasdaq-100 heatmap

Size: market cap · Color: 1-day change

Put the moves in perspective.

Load TradingView’s interactive market view. It connects your browser to TradingView; see our privacy notice.

No market widget is loaded yet.

Provider-supplied data may be delayed. Check TradingView’s displayed data status and market session. The index view has a different universe from our 50-stock watchlist. Data limitations ↗

The tech 50 watchlist

Curated for exploration, not ranked by size or a buy list. Includes tech-related businesses outside the technology sector. Links open external TradingView charts; no prices are implied by tile colors.

50 companies
How to read this section

Heatmap blocks are sized by market capitalization and colored by TradingView’s daily percentage change. A large block means a larger company, not a stronger recommendation. Select a block for provider details. Market-data availability varies by exchange.

The watchlist is an editorial selection, not an index, portfolio, sector classification or current market-cap ranking. Company symbols can change; verify the security and listing on the destination before relying on it. SEC company ticker reference · Widget source & settings.

Keep the signal

Your next catch-up, on your terms.

Add The Investor Brief to your RSS reader.

Get the feed ↗